![A cutaway rendering showing the internal spatial distribution of API, excipients, and pore space mapped using 3D imaging and machine-learning semantic segmentation. [Image credit: DigiM Solution]](https://www.drugdiscoverytrends.com/wp-content/uploads/2026/07/image-segmentation.png)
A cutaway rendering showing the internal spatial distribution of API, excipients, and pore space mapped using 3D imaging and machine-learning semantic segmentation. [Image credit: DigiM Solution]
Drug dissolution is one tool in such scientists’ toolbelt, and is one of the most basic questions in formulation development, measuring how quickly, and how completely, a drug dose releases its active ingredient. But the traditional process can be slow and iterative. Co-founder and CEO of DigiM Solution Shawn Zhang, Ph.D., calls it a “try, test, and make again cycle.” For long-acting injectables and implants, DigiM puts a single release test at 30 to 90 days or more per condition, with each reformulation restarting the clock.

Shawn Zhang, Ph.D.
Compounding matters, two distinct formulations of the same drug could have dramatically different release profiles. “From the outside two products can look the same, but once you open them up, you see the primary particles are deposited differently because of different process conditions,” said Zhang, who will be speaking on the subject at a keynote titled “Seeing Inside the Dose: Predictive Drug Development with Microstructure Intelligence” at the PharmSci 360 conference in New Orleans on October 28.
The hidden variable
Conventional assay and bulk measurements often miss the internal attributes Zhang describes, which involve the spatial distribution of the active pharmaceutical ingredient, pores and excipients within a dose.
Zhang points to a set of long-acting injectable microspheres to illustrate the challenge. “If you use conventional laser diffraction testing, the particle sizes are identical,” he said of the microspheres. “If you look at them by external scanning electron microscopy or light microscopy, they look identical.” Yet the release profiles differed. The process change responsible was invisible to standard testing.
In a joint study with the University of Connecticut and FDA that DigiM presented in an April webinar, four PLGA microsphere formulations differed only in stir rate and in the viscosity of the silicone oil used during manufacturing, and viscosity carried the larger effect on release. One batch was uniform in both API and porosity throughout the sphere. The other was patchy, with regions void of both.
DigiM has a range of tools at its disposal to help shed light on such cases. One pairs focused ion beam scanning electron microscopy (FIB-SEM), which mills away successive layers and images each freshly exposed face, with X-ray microscopy across a wider population of spheres. A single cross section cannot establish a batch trend, so the lower-resolution population data confirms whether the pattern holds. The result is a quantifiable view of where the API actually sits, at a resolution bulk testing cannot reach.
“Conceptually it’s simple,” Zhang said. “If the drug concentration is loaded more toward the external surface, it’s going to release faster. If the primary API particles are buried more toward the core, it’s going to release slower.”
See the dose
To help capture the internal architecture, the company built a network of more than 50 labs and instruments, including synchrotron facilities, that collect images on clients’ behalf. This approach enables it to focus on its digital infrastructure: representative sample prep protocols, quality controls and reproducibility. “That’s where data integrity and data confidentiality live, and it links back to our earlier discussion: eventually, no client and no regulator makes decisions based on just images,” Zhang said.
In terms of testing, computed tomography is a key pillar. “This is CT, very similar to the CT scan we get in the hospital, but these instruments let us image micro particles, tablets, and long-acting injectables at three orders of magnitude higher resolution,” Zhang said. Inputs can be as modest as a particle size measurement or a single 2D image, or as complete as a full 3D scan.
A conventional dissolution study consumes grams, sometimes tens to hundreds of grams, of material. The imaging workflow runs on a few milligrams: a few hundred to a couple of thousand particles, a single tablet, or one granule. A conventional dissolution study consumes grams, sometimes tens to hundreds of grams, of material. The imaging workflow runs on a few milligrams: a few hundred to a couple of thousand particles, a single tablet, or one granule. Early in development, many drug substances are “literally more expensive than gold,” Zhang said.
Turn pictures into data
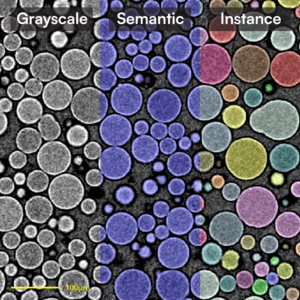
A three-stage breakdown showing how machine learning converts raw grayscale microscopy images into labeled material phases (semantic) and individual microspheres (instance) for microstructural analysis. [Image credit: DigiM Solution]
If data infrastructure keeps the images accessible, image analysis turns them into a digital map of the dose. Before DigiM can measure porosity, connectivity or API distribution, the software must determine what every shade of gray in images represents.
While the microscope records grayscale intensity, it has no inherent knowledge that one shade represents API, another represents polymer or excipient and a dark region represents pore space. In DigiM’s image analysis software, digiM I2S, a domain expert supplies that correspondence by hand-labeling a small region of a 2D image, and the software assigns each pixel in 2D or voxel in 3D a numerical material label using supervised machine learning and convolutional neural networks. A color map then makes those labeled phases easy to distinguish visually. DigiM calls this semantic segmentation, and can push it further to instance segmentation, which separates individual objects such as one pore or particle from its neighbors.
“Converting those images into what you see as color is a digital transformation: transforming grayscale pictures into actual material phases, actual particle sizes, volume fractions or mass fractions, concentration gradients,” Zhang said. “Those are the so-called critical quality attributes that development and regulatory decisions can be made on.”
DigiM has followed its core approach since 2014, which puts its pragmatic AI application well ahead of the current wave and outside its dominant form that gained traction following the 2022 launch of ChatGPT.
In contrast to the largely unlabeled data approach that the transformer architecture popularized, DigiM’s AI methodology involves his team training on small, hand-labeled sets aimed at a specific task. The narrower method makes the models more predictable and well-defined inside a regulatory and confidentiality framework.
Simulating release
While segmentation produces the map, turning that map into a release curve is where Zhang locates the difference between his company’s approach and conventional dissolution modeling.
In an April 15 webinar, Rob Holt, DigiM’s associate director for pharmaceutical sciences, explained that the process begins with empirical data, whether a particle-size measurement, a 2D image or a full 3D scan. The simulation then models how the product evolves and releases drug from that physical structure, including how its microstructure affects effective diffusivity and other mass-transport properties. A final step converts simulated time into real time using the sample’s physiochemical properties and release environment (solubility, media pH, bulk diffusion coefficient and boundary-layer thickness).
For long-acting products, the simulation runs several processes concurrently. It is “simultaneously tracking water uptake, the behavior of the polymer, and the evolution of the API network through release,” said Jonah Gautreau, lead product specialist, in the same webinar.
Established dissolution and pharmacokinetic platforms often combine mechanistic models with measured physicochemical, in vitro and clinical data. DigiM says ivisLab differs by using image-derived microstructure as a formulation-specific initial condition, allowing it to predict dissolution without fitting the model to a previously measured dissolution curve for that formulation. “The major difference is that dissoLab does not require any prior testing data,” Zhang said, referring to prior dissolution testing data used to train or calibrate the prediction. The workflow still relies physicochemical inputs. In practice, this means a formulator can get a directional release prediction before manufacturing a single batch, rather than after, Zhang says.
Working backward from a release target
Once the model can predict release from a measured microstructure, the next question runs in reverse: What internal architecture would produce a target release profile?
Zhang said DigiM began developing its generative AI approach around 2021, driven by “several imminent drug development challenges.” That work led to a 2024 Nature Communications paper with co-authors from Genentech and Merck. In one case study, the team generated virtual tablet microstructures to identify the point at which microcrystalline cellulose formed a continuous network. The paper predicted a percolation threshold of 4.2% by weight and validating it against physical tablets containing 2% and 5%.
The tablet study focused on MCC (Microcrystalline Cellulose), an excipient. The same connectivity question can apply to the API itself. Zhang explains the underlying principle with chocolate-chip cookies. “If you and I are making chocolate chip cookies, how many chocolate chips do we put in the cookie so that the chocolate-chip particles connect to each other and so every bite of the cookie has the same amount of chocolate?”
For a drug product, the chips in the analogy represent the API. A connected API phase can provide a continuous route through the dose as the drug dissolves. Widely separated API domains depend more heavily on diffusion through surrounding excipients or on the dosage form swelling, eroding or breaking apart.
“If the API is connected into a network, the API can find its way out through the dissolved API,” Zhang said. “This is called percolation. Conversely, if my chocolate chips are all dispersed, the API is all isolated islands.”
Finding that threshold experimentally means manufacturing and testing a series of formulations at different loadings. The generative model instead starts from an image of an existing microstructure and produces variants in which one attribute changes while the rest of the structure holds. In the Nature Communications paper, the team trained on tablets at 10% and 30% MCC, generated a structure at 20.1%, then compared it against a real 20% tablet the model had never seen, matching it on particle size distribution, simulated mercury intrusion and permeability. In a second case study, the team used one FIB-SEM image to generate virtual versions of a long-acting islatravir implant with different core-to-surface drug distributions. Larger particles near the surface slowed the simulated initial burst, showing how gradients that can arise during hot-melt extrusion could affect the implant’s projected 24-month release profile.
“I just need to digitally increase the amount of chocolate chips, keeping the rest of the morphology, until my chocolate connects,” Zhang said. “Using this generative AI, we can answer such a pivotal pharmaceutical development question without making them.” Building fewer formulations, running fewer manufacturing campaigns and doing less wet lab testing lowers cost and shortens timelines, he said.
Regulatory implications
The digiM team has supported FDA regulatory science projects focused on microstructure characterization, and microstructure ameness has been an integral part of FDA’s bioequivalence framework. Drug-particle size, spatial distribution and pore networks can influence release behavior and product performance.
Two recent FDA draft product-specific guidances show how those measurements are entering proposed bioequivalence pathways. A November 2025 draft guidance for generic minocycline hydrochloride dental extended-release powder offers an in vitro alternative to a comparative clinical endpoint study. That route calls for comparative characterization of microsphere porosity, drug-particle size and the spatial distribution of drug particles and pores, using at least two orthogonal methods. The guidance cites a FIB-SEM paper co-authored by digiM researchers, work Zhang said the company conducted under an FDA grant.
A May 2026 draft guidance for generic dexamethasone ophthalmic inserts lists microstructure imaging as a comparative study and identifies porosity, pore-size distribution, drug-particle size and spatial distribution as key measurements. The guidance cites a 2025 paper from FDA scientists that applied the imaging workflow to dexamethasone-loaded inserts.
Both guidances remain drafts and carry nonbinding recommendations. Zhang treats the agency’s attention as a starting point. “Eventually, it is the totality of scientific evidence that will speak for itself,” he said.
Filed Under: Drug Discovery and Development, machine learning and AI