Drug Discovery and Development

  • Home Drug Discovery and Development
  • Drug Discovery
  • Women in Pharma and Biotech
  • Oncology
  • Neurological Disease
  • Infectious Disease
  • Resources
    • Video features
    • Podcast
    • Views
    • Webinars
    • PharmSci360
  • Pharma 50
    • 2026 Pharma 50
    • 2025 Pharma 50
    • 2024 Pharma 50
    • 2023 Pharma 50
    • 2022 Pharma 50
    • 2021 Pharma 50
  • Advertise
  • SUBSCRIBE

A merged AstraZeneca and BMS could lead Lilly on revenue until about 2030

By Brian Buntz | August 4, 2026

In a potential marriage that analysts said faces long odds, AstraZeneca and Bristol Myers Squibb have held talks on a merger that would create the world’s largest drugmaker by revenue and rank among the biggest deals in pharmaceutical history, the Financial Times reported.

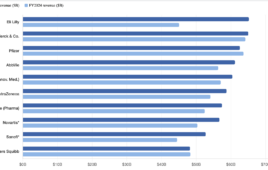
The merger would also mark the most significant reshaping of pharma’s top tier since Lilly jumped from ninth-largest to the top slot by revenue on the strength of its metabolic franchise. It claimed the top spot with $65.18 billion, roughly two-thirds of the $100.33 billion Pfizer booked at its pandemic peak in 2022.

A combined AstraZeneca and BMS would reset that bar. The company would hold one of the industry’s broadest oncology portfolios, pairing AstraZeneca’s Tagrisso, Imfinzi and Calquence and the Daiichi Sankyo-partnered ADCs Enhertu and Datroway with BMS’s Opdivo, Yervoy and Opdualag, while adding BMS’s hematology, cell therapy and neuroscience franchises to AstraZeneca’s current mix. Based on their FY2025 filings, the pair would have spent $24.18 billion on R&D, above every standalone company in the Pharma 50 data. Reported spending among Roche, Lilly, J&J and Merck ranged from $12.52 billion to $15.79 billion, although acquired in-process R&D and differences in reporting scope make the comparison approximate.

AstraZeneca and BMS generated a combined $106.94 billion in 2025, compared with Lilly’s $65.18 billion. Current AstraZeneca and BMS guidance and an R&D World model of Lilly’s full-year revenue, built from its reported first quarter and historical quarterly pattern, put 2026 revenue at roughly $112.6 billion for the hypothetical combination and $87 billion for Lilly. That would leave Lilly growing about 33% this year against roughly 5% for the merged pair. Running both forward, the model puts the median crossover around 2030; in about a third of simulations, the merged company remained ahead in 2032 or later.

Analysts remained skeptical. Jefferies analysts led by Michael Leuchten wrote that they were “a bit perplexed” given AstraZeneca’s growth and innovation profile, adding that if any company does not need financial engineering, it is AstraZeneca. Citi called the report a surprise given the pipeline. RBC told clients that agreeing on value may prove difficult. BMO Capital Markets wrote that significant business overlap makes a deal less likely to materialize and estimated deal capacity at roughly $32 billion for BMS and $37 billion for AstraZeneca, meaning neither can buy the other outright.

Note about the projections. FY2024 and FY2025 revenue and R&D figures come from R&D World’s Pharma 50 datasets, compiled from company filings and annual reports. Non-USD figures were converted at IRS annual-average exchange rates. Division revenue was used for diversified companies where available; R&D scope varies by company and is flagged in the underlying data. AstraZeneca’s FY2026 estimate applies a 6% to 9% growth range to FY2025 revenue, and BMS uses the midpoint of its current $49 billion to $50 billion guidance; both were checked against reported first-half results. Lilly’s FY2026 estimate comes from Monte Carlo simulations anchored to reported Q1 revenue and the 2024–2025 quarter-to-quarter pattern. A scenario parameter controls how much of that pattern repeats, with quarterly variation added. Using reported quarterly figures, the model yielded a median of $86.9 billion and a central 80% interval of $81.0 billion to $94.1 billion, compared with Lilly’s $82 billion to $85 billion guidance. For 2027 onward, the model centers Lilly’s growth at 13% in 2027, tapering to roughly 7% by 2033, and the combination’s growth at 4.5% a year. It assumes no divestitures or merger-related revenue attrition. Of course, pipeline changes and other factors can make long-term projections inaccurate. Lilly reports second-quarter results Aug. 5.

Filed Under: Pharma 50
Tagged With: analyst skepticism, AstraZeneca, Big Pharma, BMS, Bristol-Myers Squibb, Calquence, Datroway, deal capacity, Eli Lilly, Enhertu, financial engineering, Imfinzi, Monte Carlo model, oncology portfolio, Opdivo, Opdualag, pharma merger, pharmaceutical industry, R&D spending, revenue forecast, Tagrisso, Yervoy
 

About The Author

Brian Buntz

As the pharma and biotech editor at WTWH Media, Brian has almost two decades of experience in B2B media, with a focus on healthcare and technology. While he has long maintained a keen interest in AI, more recently Brian has made making data analysis a central focus, and is exploring tools ranging from NLP and clustering to predictive analytics.

Throughout his 18-year tenure, Brian has covered an array of life science topics, including clinical trials, medical devices, and drug discovery and development. Prior to WTWH, he held the title of content director at Informa, where he focused on topics such as connected devices, cybersecurity, AI and Industry 4.0. A dedicated decade at UBM saw Brian providing in-depth coverage of the medical device sector. Engage with Brian on LinkedIn or drop him an email at [email protected].

Related Articles Read More >

Pharma 50: The 50 best-selling drugs of FY2025
Pharma 50: Keytruda holds the top brand slot, but tirzepatide and semaglutide have already passed it at the molecule level in FY2025
Pharma 50 2026: The top spot in pharma rarely lasts. Lilly is betting it can change that.
Lilly is now the top pharma company by revenue as Mounjaro (+99%) and Zepbound (+175%) combine for $36.5B in FY2025
“ddd
EXPAND YOUR KNOWLEDGE AND STAY CONNECTED
Get the latest news and trends happening now in the drug discovery and development industry.

MEDTECH 100 INDEX

Medtech 100 logo
Market Summary > Current Price
The MedTech 100 is a financial index calculated using the BIG100 companies covered in Medical Design and Outsourcing.
Drug Discovery and Development
  • MassDevice
  • DeviceTalks
  • Drug Delivery Business News
  • Medtech100 Index
  • Medical Design Sourcing
  • Medical Design & Outsourcing
  • Medical Tubing + Extrusion
  • Pharmaceutical Processing World
  • R&D World
  • Subscribe to our E-Newsletter
  • About Us
  • Contact Us

Copyright © 2026 Arrowfly LLC. All Rights Reserved. The material on this site may not be reproduced, distributed, transmitted, cached or otherwise used, except with the prior written permission of Arrowfly
Privacy Policy | Advertising | About Us

Search Drug Discovery & Development

  • Home Drug Discovery and Development
  • Drug Discovery
  • Women in Pharma and Biotech
  • Oncology
  • Neurological Disease
  • Infectious Disease
  • Resources
    • Video features
    • Podcast
    • Views
    • Webinars
    • PharmSci360
  • Pharma 50
    • 2026 Pharma 50
    • 2025 Pharma 50
    • 2024 Pharma 50
    • 2023 Pharma 50
    • 2022 Pharma 50
    • 2021 Pharma 50
  • Advertise
  • SUBSCRIBE